It should only take a few minutes to get started tracking events with these three steps:
Tracking events should only take a few minutes with these four steps:
1- Install the Pelcro JavaScript SDK
The first step is to install our SDK on your page. You can grab the SDK script from your dashboard. There are custom solutions for iOS and Android, please contact us for more info.
To install the library, paste the following code into the <head> section of your website’s HTML page:
2- Track default events
By default, page view events are tracked via Pelcro’s SDK. There is no need to trigger a custom event for every page view. Any interaction with our modals, meter or any view that Pelcro displays (if enabled) are automatically tracked and reported to your dashboard. If you are not using out default flows, then you might want to continue reading to learn how you can trigger custom events and properties.
3- Track custom events
Events are captured programmatically using code. In this example, an event named “Button clicked” is triggered. You should plan out and prioritize all the events that are relevant and important to your business and make sure they are all tracked. You should always have to goals in mind, what do I need to track and what data do I need for machine learning.
<script type="text/javascript">
    pelcro.track("Button clicked");
</script>
4- Add custom properties
In the example below, we are adding two custom properties to the event in the previous example. By default, we track the following properties to every event that is triggered, so there is no need to do that again.
<script type="text/javascript">
    pelcro.track("Button clicked", {
        "name": Facebook like,
        "color": "Blue"
    });
</script>
Default properties: This list is not exhaustive. We frequently add to this list any property we deem useful to our clients. You can view the up to date list in the segmentation report on your dashboard.
- Country
- Region
- Scroll percentage at the time of the event
- Time spent at the time of the event
- UTM tags (source, medium, campaign, content, term)
- Platform
- Ad blocking status
- Device
- Referral source
- Frequency (frequency of visitor on the site)
- Device fingerprint
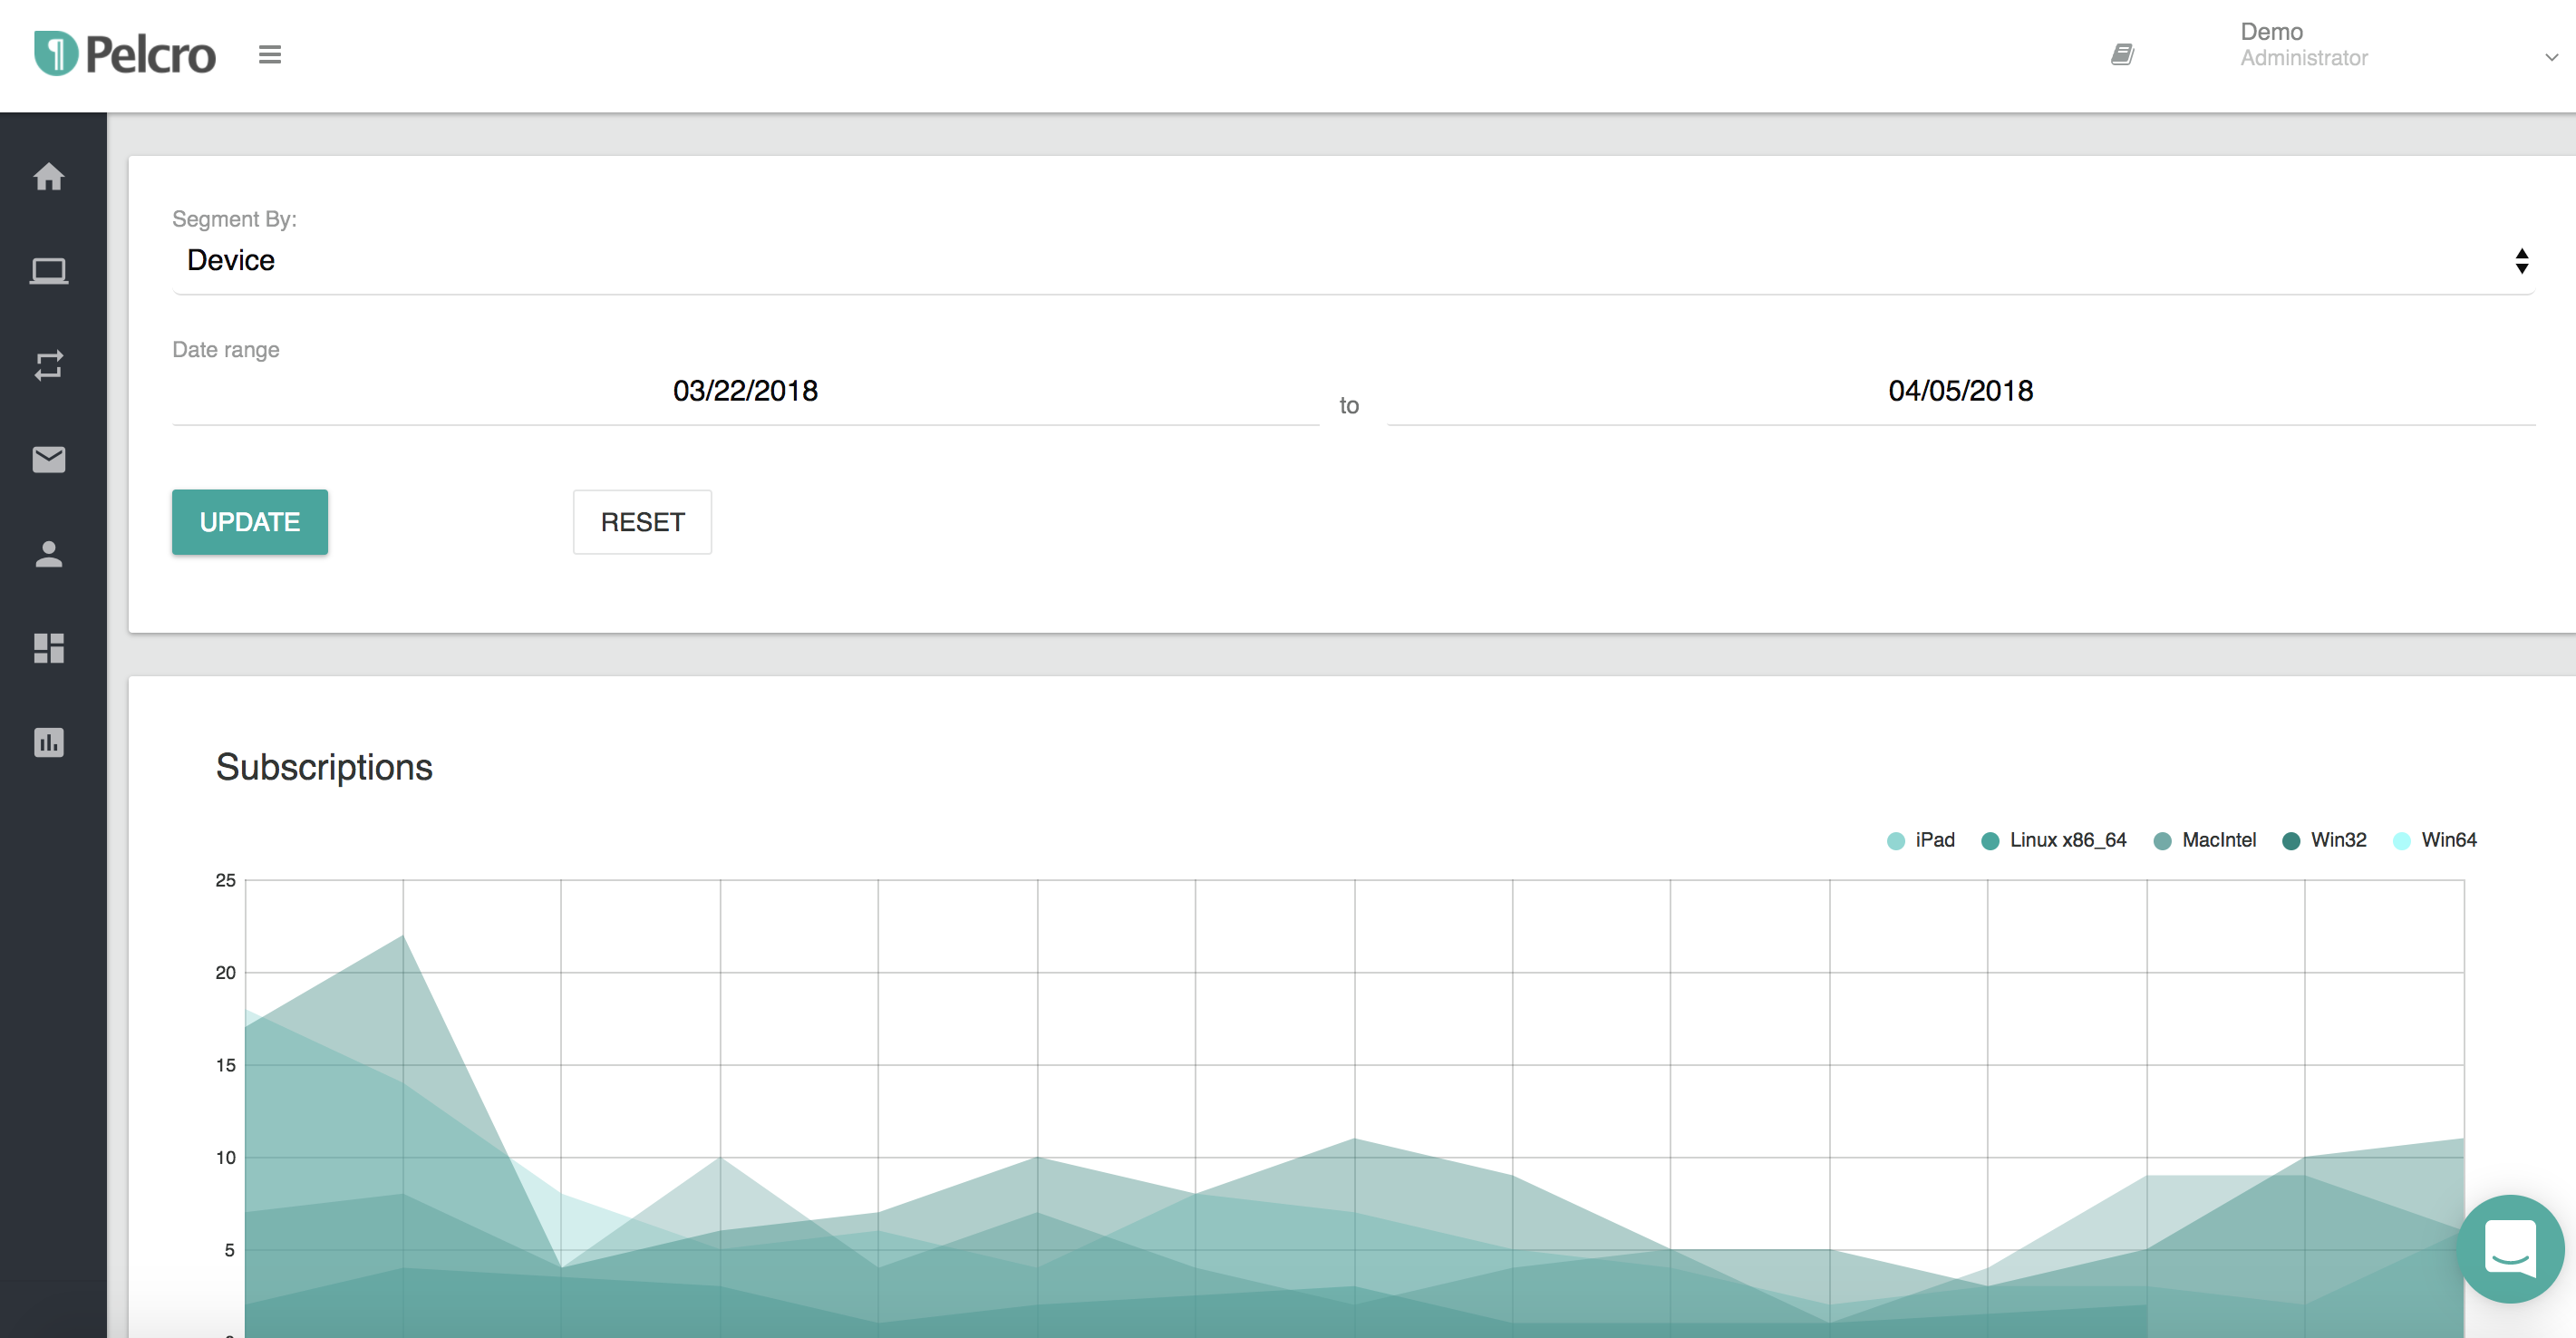
5- Analyze data using our segmentation tool or export it
You are all set and data should be visible in your the segmentation report and dashboard. Below is how the segmentation tool will look like. Below is a breakdown of a subscription event broken down by device type.